VERITAS ANALYSIS
[1]:
from vtspy import *
WARNING: version mismatch between CFITSIO header (v4.000999999999999) and linked library (v4.01).


WARNING: version mismatch between CFITSIO header (v4.000999999999999) and linked library (v4.01).


WARNING: version mismatch between CFITSIO header (v4.000999999999999) and linked library (v4.01).
Step 1. Generate a configuration file
[2]:
ls ./veritas
95127.anasum.fits  95130.anasum.fits  initial.pickle
95128.anasum.fits  analyzed.pickle    obs-index.fits.gz
95129.anasum.fits  hdu-index.fits.gz  simple.pickle
[3]:
config = JointConfig(files="./veritas/")
2022-06-23 13:10:08 INFO    : -------------------- Info --------------------
2022-06-23 13:10:08 INFO    : target: 1ES1218+304
2022-06-23 13:10:08 INFO    : localization:
2022-06-23 13:10:08 INFO    :   (ra, dec) : (185.3412470056114, 30.17694222440679)
2022-06-23 13:10:08 INFO    :   (glat, glon) : (82.73442268671826, 186.3593855387067)
2022-06-23 13:10:08 INFO    : time interval:
2022-06-23 13:10:08 INFO    :   veritas : 2020-01-01T11:15:10.479 - 2020-01-01T13:15:02.043
2022-06-23 13:10:08 INFO    :   fermi : 2020-01-01 00:00:00.000 - 2020-01-02 00:00:00.000
2022-06-23 13:10:08 INFO    : ---------------------------------------------
2022-06-23 13:10:08 INFO    : a configuration file (config.yaml) is created.
[4]:
config.print_config()
2022-06-23 13:10:08 INFO    :
fermi:
  binning:
    binsperdec: 8
    binsz: 0.08
    coordsys: CEL
    projtype: WCS
    roiwidth: 12
  data:
    evfile: ./fermi/EV00.lst
    ltcube: null
    scfile: ./fermi/SC00.fits
  fileio:
    logfile: ./fermi/log/fermipy.log
    outdir: ./fermi/
    usescratch: false
  gtlike:
    edisp: true
    edisp_disable:
    - isodiff
    - galdiff
    irfs: P8R3_SOURCE_V3
  model:
    catalogs: /Users/dtak/Research/scripts/vts-fermi/vtspy/refdata/gll_psc_v22.fit
    galdiff: $FERMI_DIFFUSE_DIR/gll_iem_v07.fits
    isodiff: $FERMI_DIFFUSE_DIR/iso_P8R3_SOURCE_V3_v1.txt
    src_roiwidth: 15
  selection:
    dec: 30.17694222440679
    emax: 300000
    emin: 100
    evclass: 128
    evtype: 3
    glat: 82.73442268671826
    glon: 186.3593855387067
    ra: 185.3412470056114
    target: 1ES1218+304
    tmax: 599616005.0
    tmin: 599529605.0
    zmax: 90
veritas:
  background:
    distance: 1.75
    file: /Users/dtak/Research/scripts/vts-fermi/vtspy/refdata/Hipparcos_MAG8_1997.dat
    magnitude: 7
    simbad: true
  cuts:
    bias_cut: 0
    eff_cut: 0
    th2cut: 0.008
  data:
    anasum: ./veritas
  fileio:
    outdir: ./veritas/
  selection:
    dec: 30.17694222440679
    emax: 10
    emin: 0.1
    exc_on_region_radius: 0.7
    exc_radius: 0.25
    format: mjd
    glat: 82.73442268671826
    glon: 186.3593855387067
    max_region_number: 6
    nbin: 6
    ra: 185.3412470056114
    radius: 2.0
    target: 1ES1218+304
    tmax: 58849.552106979165
    tmin: 58849.46887128472
Step 2. Analyze the VERITAS data
[5]:
veritas = VeritasAnalysis(overwrite=True)
2022-06-23 13:10:09 INFO    : Initialize the VERITAS analysis.
2022-06-23 13:10:09 INFO    : Load the data files.
2022-06-23 13:10:09 INFO    : Observations selected: 4 out of 4.
2022-06-23 13:10:09 INFO    : The number of observations is 4
2022-06-23 13:10:09 INFO    : Define exclusion regions.
2022-06-23 13:10:09 INFO    : Querying bright sources within FoV with Simbad.
2022-06-23 13:10:10 INFO    : 4 sources have been found.
2022-06-23 13:10:10 INFO    : Define ON- and OFF-regions.
2022-06-23 13:10:15 INFO    : N_on: 346, N_off: 391, alpha: 0.167, and sigma=21.2
2022-06-23 13:10:15 INFO    : The initial setup is saved [state_file = initial].
2022-06-23 13:10:15 INFO    : Completed (VERITAS initialization).
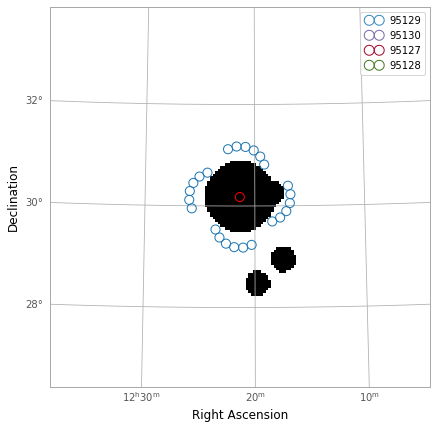
Plot ON- and OFF- regions
[6]:
veritas.plot("roi")
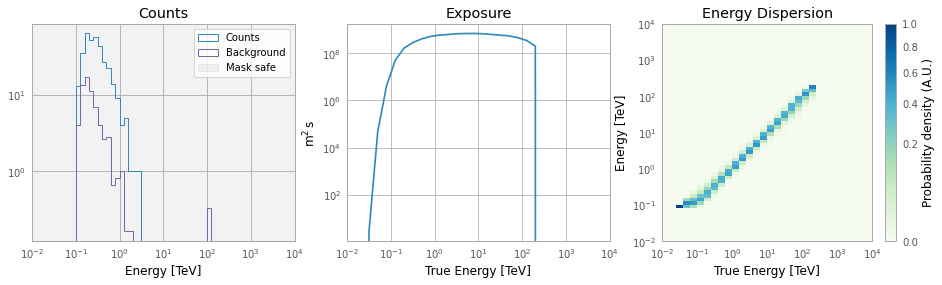
Peek dataset
[7]:
veritas.peek_dataset()
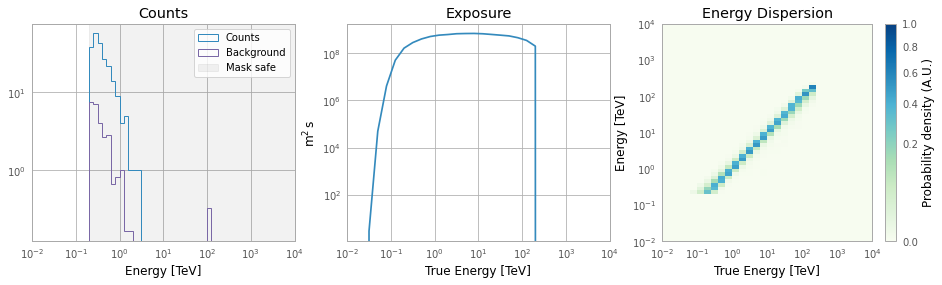
Apply additional cuts
[8]:
veritas.construct_dataset(eff_cut=15, bias_cut=15)
2022-06-23 13:10:25 INFO : N_on: 222, N_off: 163, alpha: 0.167, and sigma=19.7
[9]:
veritas.peek_dataset()
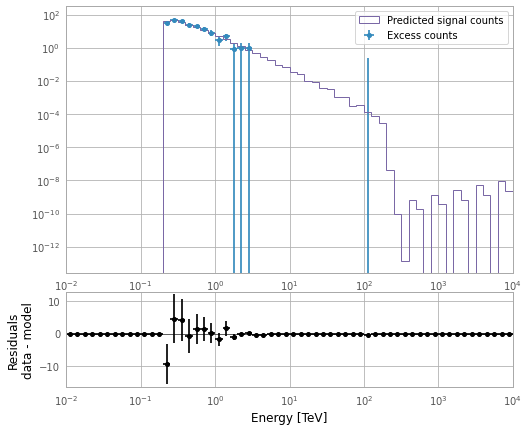
Perform a fit and do high-level analyses
[10]:
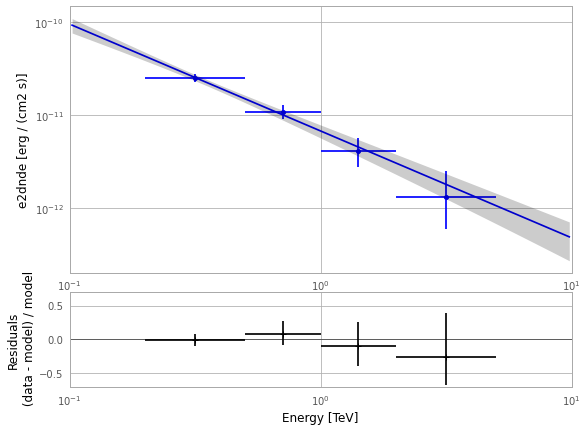
veritas.fit(model="PowerLaw")
veritas.plot("fit")
print(veritas.fit_results.total_stat)
2022-06-23 13:10:29 INFO    : Fit successfully.
2022-06-23 13:10:29 INFO    : The state is saved as 'simple'. You can load the state by vtspy.VeritasAnalysis('simple').
8.286826202930362
[11]:
ls ./veritas
95127.anasum.fits  95130.anasum.fits  initial.pickle
95128.anasum.fits  analyzed.pickle    obs-index.fits.gz
95129.anasum.fits  hdu-index.fits.gz  simple.pickle
[12]:
veritas.analysis()
2022-06-23 13:10:31 INFO    : Generating flux points and SED...
2022-06-23 13:10:39 INFO    : Completed.
2022-06-23 13:10:40 INFO    : The state is saved as 'analyzed'. You can load the state by vtspy.VeritasAnalysis('analyzed').
Plot the results
[13]:
veritas.plot("flux")
[14]:
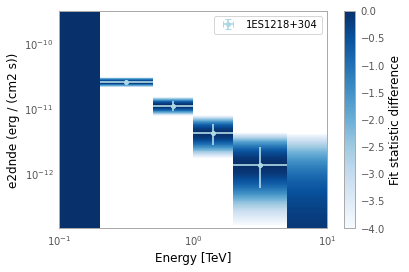
veritas.plot("sed")
[15]:
veritas.print_flux()
[15]:
Table length=6
| e_ref | e_min | e_max | e2dnde | e2dnde_err | e2dnde_errp | e2dnde_errn | e2dnde_ul | ts | sqrt_ts | npred | npred_excess | stat | is_ul | counts | success | norm_scan | stat_scan |
|---|---|---|---|---|---|---|---|---|---|---|---|---|---|---|---|---|---|
| TeV | TeV | TeV | TeV / (cm2 s) | TeV / (cm2 s) | TeV / (cm2 s) | TeV / (cm2 s) | TeV / (cm2 s) | ||||||||||
| float64 | float64 | float64 | float64 | float64 | float64 | float64 | float64 | float64 | float64 | float64[1] | float32[1] | float64 | bool | float64[1] | bool | float64[11] | float64[11] |
| 0.141 | 0.100 | 0.200 | nan | nan | nan | nan | nan | nan | nan | nan | 0.0 | 0.000 | False | 0.0 | False | 0.200 .. 5.000 | nan .. nan |
| 0.316 | 0.200 | 0.501 | 1.582e-11 | 1.423e-12 | 1.460e-12 | 1.388e-12 | 1.881e-11 | 284.767 | 16.875 | 165.3151504825863 | 144.20168 | 2.921 | False | 165.0 | True | 0.200 .. 5.000 | 149.504 .. 665.632 |
| 0.708 | 0.501 | 1.000 | 6.846e-12 | 1.137e-12 | 1.193e-12 | 1.082e-12 | 9.346e-12 | 92.381 | 9.612 | 45.01661193588719 | 40.686104 | 0.025 | False | 45.0 | True | 0.200 .. 5.000 | 48.890 .. 162.791 |
| 1.413 | 1.000 | 1.995 | 2.564e-12 | 9.189e-13 | 1.019e-12 | 8.296e-13 | 4.813e-12 | 17.920 | 4.233 | 10.165660799566224 | 8.863527 | 1.825 | False | 10.0 | True | 0.200 .. 5.000 | 10.565 .. 50.277 |
| 3.162 | 1.995 | 5.012 | 8.344e-13 | 5.900e-13 | 7.366e-13 | 4.600e-13 | 2.625e-12 | 6.300 | 2.510 | 1.9999876712352769 | 1.9999877 | 1.484 | False | 2.0 | True | 0.200 .. 5.000 | 3.789 .. 16.942 |
| 7.079 | 5.012 | 10.000 | nan | nan | 6.345e-13 | nan | nan | -0.000 | -0.000 | 5.257018186085354e-05 | 5.257018e-05 | 0.000 | True | 0.0 | False | 0.200 .. 5.000 | 0.141 .. 3.533 |
Generate light curve
[16]:
veritas.analysis(jobs="lc", nbins=2)
2022-06-23 13:10:43 INFO    : Generating lightcurve...
2022-06-23 13:10:43 INFO    : The number of time intervals is 2
2022-06-23 13:10:46 INFO    : Generating lightcurve is completed.
2022-06-23 13:10:46 INFO    : The state is saved as 'analyzed'. You can load the state by vtspy.VeritasAnalysis('analyzed').
[17]:
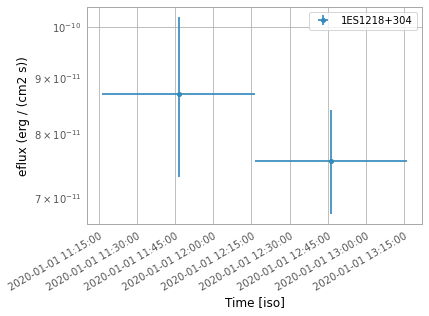
veritas.plot("lc")
[18]:
veritas.print_lightcurve()
[18]:
Table length=2
| time_min | time_max | e_ref | e_min | e_max | eflux | eflux_err | eflux_errp | eflux_errn | eflux_ul | ts | sqrt_ts | npred | npred_excess | stat | is_ul | counts | success | norm_scan | stat_scan |
|---|---|---|---|---|---|---|---|---|---|---|---|---|---|---|---|---|---|---|---|
| TeV | TeV | TeV | TeV / (cm2 s) | TeV / (cm2 s) | TeV / (cm2 s) | TeV / (cm2 s) | TeV / (cm2 s) | ||||||||||||
| float64 | float64 | float64[1] | float64[1] | float64[1] | float64[1] | float64[1] | float64[1] | float64[1] | float64[1] | float64[1] | float64[1] | float64[1,4] | float64[1,4] | float64[1] | bool[1] | float64[1,4] | bool[1] | float64[1,11] | float64[1,11] |
| 58849.46967202546 | 58849.51128987268 | 1.0000000000000002 | 0.10000000000000002 | 10.000000000000002 | 5.4265711779484334e-11 | 9.085111481890766e-12 | 9.524792391156496e-12 | 8.659349138480458e-12 | 7.422092077215183e-11 | 83.39786414094083 | 9.132243105663626 | nan .. nan | nan .. nan | 6.177400630136317 | False | nan .. nan | True | 0.2 .. 4.999999999999999 | 50.91140798765545 .. 178.51796246786486 |
| 58849.51128987268 | 58849.5529077199 | 1.0000000000000002 | 0.10000000000000002 | 10.000000000000002 | 4.713645818327796e-11 | 5.136351735128114e-12 | 5.2719693767906815e-12 | 4.973648952852488e-12 | 5.801252050317832e-11 | 203.78592005341673 | 14.275360592763208 | 53.71317737321075 .. nan | 48.0087890625 .. nan | 31.92495604248873 | False | 53.0 .. nan | True | 0.2 .. 4.999999999999999 | 129.62314417037635 .. 544.9638753391071 |
[ ]: